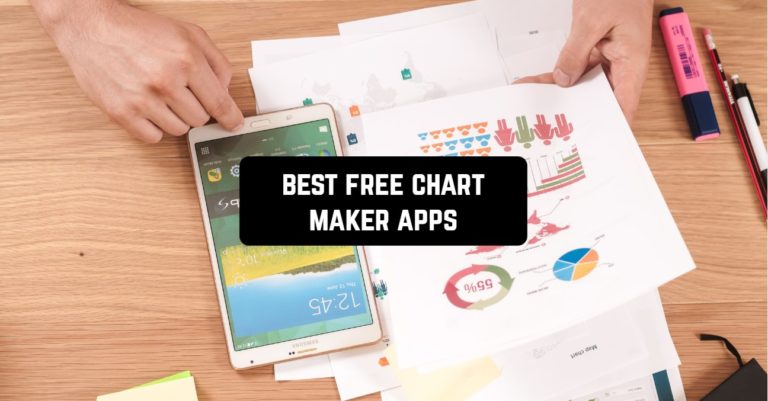
Charts and tables are a good way to present a large amount of information in a non-boring way, explaining the benefits of the format and useful tools. Charts are accessible even to beginners using uncomplicated programs.
Thus, today we have collected the best applications that create charts for your eyes. In addition, we gathered Best Slack Apps that will be useful in teamwork on joint projects.
1. Chart Maker Pro: Create Chart For Free
This app will allow you to create charts and graphs. When you enter the program, you may see a friendly white interface and a brief registration. You will be able to log in through your social networks and immediately start working on your tables.
Using this app is fairly easy, you will just need to enter your data into a table and the app will create a bar chart or a diagram on your preference. Besides, the application supports many different charts and tables, you will be able to choose any of them to present your information.
Also, the main feature of this application is that you can modify your bar graphs and charts without losing information. In addition, the application offers you a full-color palette for painting your tables and information as well as a small set of tools to help you modify the tables as you need.
After creating your charts you can download them to your device or share them directly through the app.

You may also like: 11 Best Planner Apps For iPad
2. Chart Maker – Create Charts
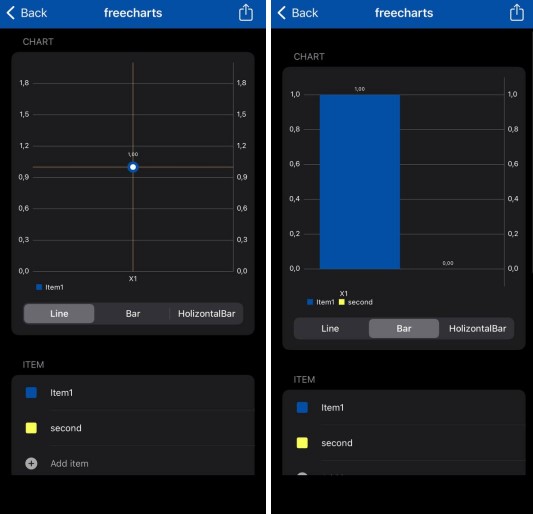
This is an app that lets you create bar graphs and line graphs without any effort. In addition, the application offers complete freedom of action. So you can create and edit any charts you want. The application has several types of charts: line one, bar one, and horizontal bar one.
You can also export it as a PDF image or in text format whenever you like. In addition, the program allows you to edit the style of tables by changing the color. Besides, it will be useful both on your phone and tablet.

3. EZ Charts – Chart Maker tool
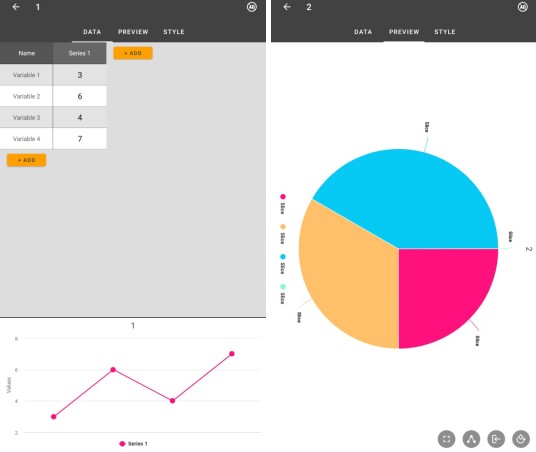
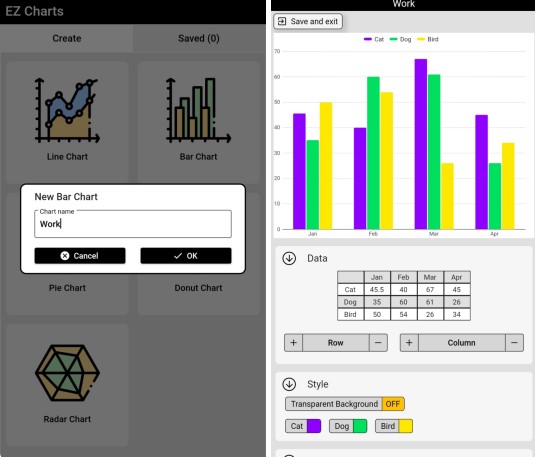
This app is quite sufficient for quick, straightforward information delivery. After all, it includes the most basic functions. Moreover, there are lines, bar, pie, donut, and radar charts presented in a pleasant style. To create one of them you just need to click on the one you like. Then you can see how the chart changes depending on the added information.
In addition, you can work on the style of presentation of the information. For example, you can add the background color and the color of the chart parts. Besides, you can choose both standard colors and use the RGB palette. After that, the result is possible to export, which is to save or share in PNG format.
It is also worth noting that the saved work is stored in the program. Thus, each shows the date of creation of the chart. In addition, the obvious plus of this program is its design and simplicity in which it is pleasant to work.

4. Graph Generator
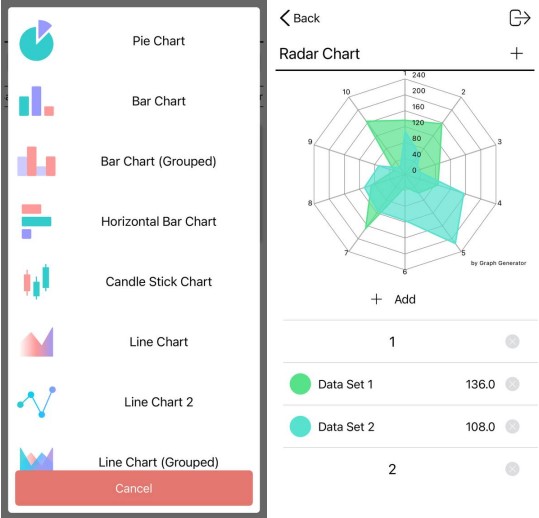
This application will allow you to create diagrams for study, work, management, and other needs. The app welcomes you with a nice soft-white interface and user-friendly features. To create a chart, you will need to enter data into a table, the rest the app will do for you.
You can also customize the size of the chart, and modify the content of the chart and its appearance. It offers you colorful, structured, and customizable charts that you can use with ease. In addition, it stores all your data in the cloud, so you can log in from any device without losing your data.
The app automatically backs up all your files to the cloud, so you can stop worrying about the safety of your charts. In addition, you can protect your information with a biometric lock and password.
It is worth noting that the application gives complete freedom of action, you can create everything you need, as well as unlimited export of your graphics in PDF, JPEG, and PNG. Thanks to the complete absence of ads, you will be able to fully experience the pleasantness of using this application and immerse yourself in the work on your charts.

5. Simple graph maker
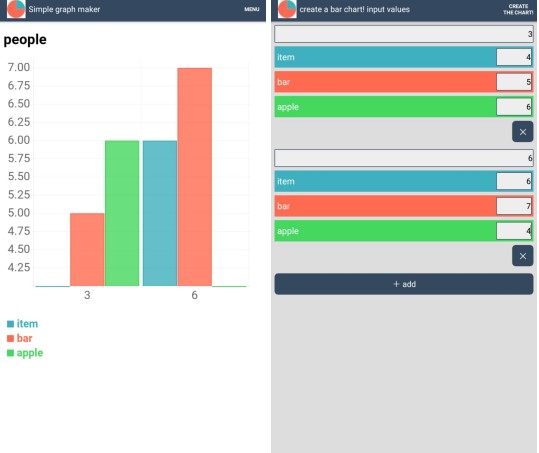
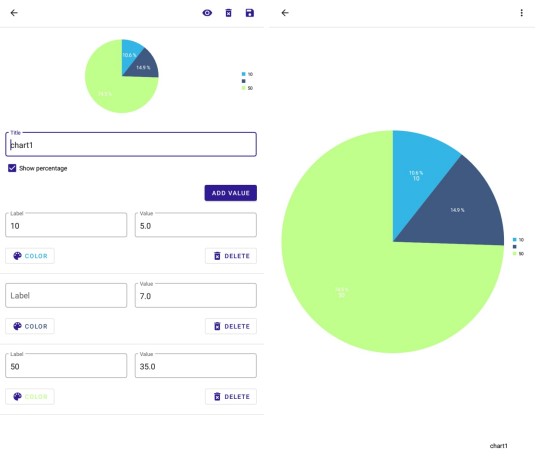
This is a simple graphics tool that allows you quickly create graphs and charts. You are greeted by a minimalistic interface and custom functionality when you enter the app. The program’s simplicity allows you to create an uncomplicated graph or a pie chart in a few seconds.
When you create a chart, the application offers you to name it, as well as to keep the information by color. In addition, you will be able to enter percentages to make your chart look more presentable. You can create an unlimited number of charts, histograms, and graphs, and then you can instantly export your documents wherever you want.
Besides, all your charts and graphs will be stored in a separate folder so that you can access and use them anytime for your purposes. This application is great for work because you will be able to monitor all your progress and create charts or graphs that you need instantly.

You may also like: 11 Best apps to help you with homework
6. Chartistic – Charting App
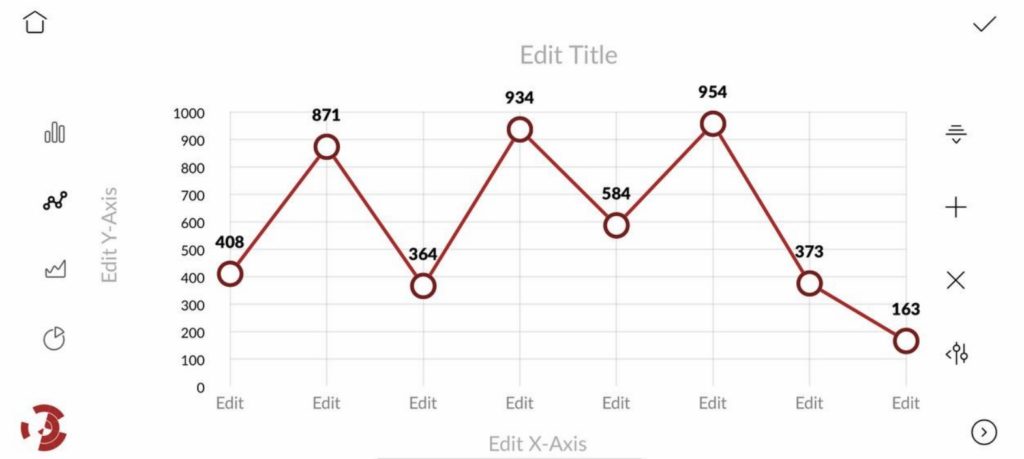
A great application that will allow you to easily create any kind of graphs, presentation, or charts. Chartists offer you an extensive range of interactive bar charts, line charts, and pie charts that you can use for whatever you want to. In addition, the app has tried to save you from the routine work of creating diagrams.
To create your diagram, you only need to enter the data into a table, the rest the app makes for you. You will be able to create and modify your charts in seconds. Also, you can export your diagrams as images or insert them into presentations.
Besides, you can send your documents anywhere you want or export them to your device as PDF, JPEG, or PNG. In addition, the application has a very beautiful visualizer that will help you enrich your charts or graphs with colorful colors. The app also provides a complete set of tools to modify your charts as needed.

7. PieChart Maker: Circular Graph Generator
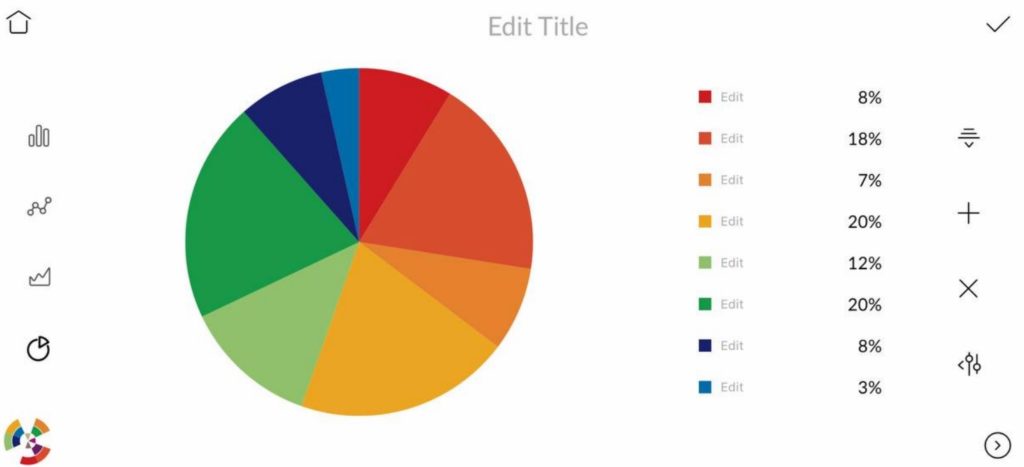
This is a minimalistic application that helps you quickly and easily create pie charts. This application does not have much functionality, but it allows you to quickly create a chart and use it for your work. You will be able to visualize your charts in real-time, as well as set the color for each displayed value.
There is also the option to set up graphical preview options so that you can evaluate your chart and complete it to perfection. A huge benefit of this feature is exporting your data from Excel directly into the app. You will not have to enter the data again, the app will automatically create a pie chart and then you finish it to your preference.
In addition, you can export your pie charts to your device with one click or send them directly from the app to anywhere you need them.

You may also like: 11 Free Voice Aloud Reader Apps
8. Numbers
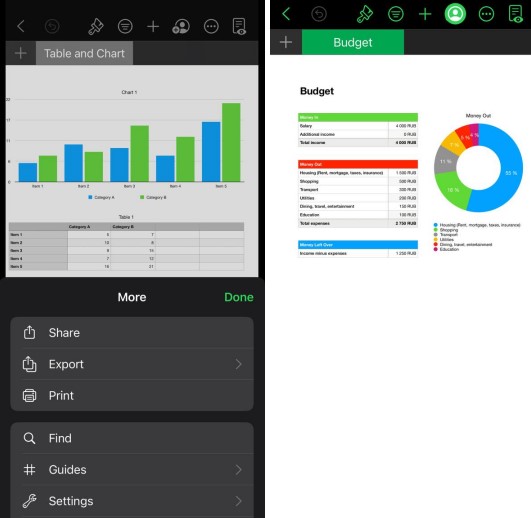
This versatile app is capable of working with any iOS device. In general, it is a built-in program for creating and editing charts on the go. In addition, the distinguishing feature of this program is that you can get updates with new features and bug fixes quite often.
There is also a sufficient number of ready-made templates that you can use for the financial plan, business, personal needs, and much more. Moreover, you can easily change the appearance of the chart and its design. Furthermore, all information can be presented in both 2D and 3D.
Another possibility is to edit the work on different devices as well as with other people. In addition, it is characterized by ease of editing and design of the overall document. So, you can rearrange, move and add objects. And a single click on an object allows you to delete, copy, cut, select, and add object comments.
There are of course other possibilities to create a unique presentation of information. In addition, it is worth noting that the program works in collaboration with other applications from Apple, which simplifies the work with texts and presentations.

9. Google Sheets
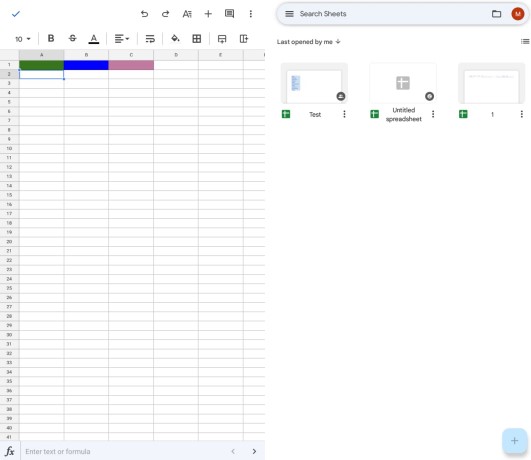
This is quite a popular application to work with, you will need a Google account, which most likely you already have. You can create a new table or edit an old one on the main screen of the service, where the last used tables are displayed. It has all the familiar Excel tools that allow you to create completely different charts and tables.
First of all, you can present the information more clearly using different types of charts. There are pie charts, line charts, surface charts, bar charts, and other types of charts. Also, you can easily change the color and size by adding new sectors. In addition, all actions can be undone and repeated, the document can be printed, and the format can be copied.
In addition, you can change the scale, data format in cells, font, font size, text and cell formatting, text alignment, etc. Moreover, you do not need to save the table, because everything is automatically stored on disk while you work. After you finish the work, you can just close the file, and the data will not be lost.
Another undeniable advantage of the application is the ability to work with others. If you want to open your file to your colleagues, all you have to do is set up one-click access.
